- View and copy JSON data.
- Log in to the cloud platform console and choose Cloud Monitor > Dashboard to enter the dashboard list.
- Choose the corresponding dashboard, click the settings icon, and select JSON on the dashboard management page.
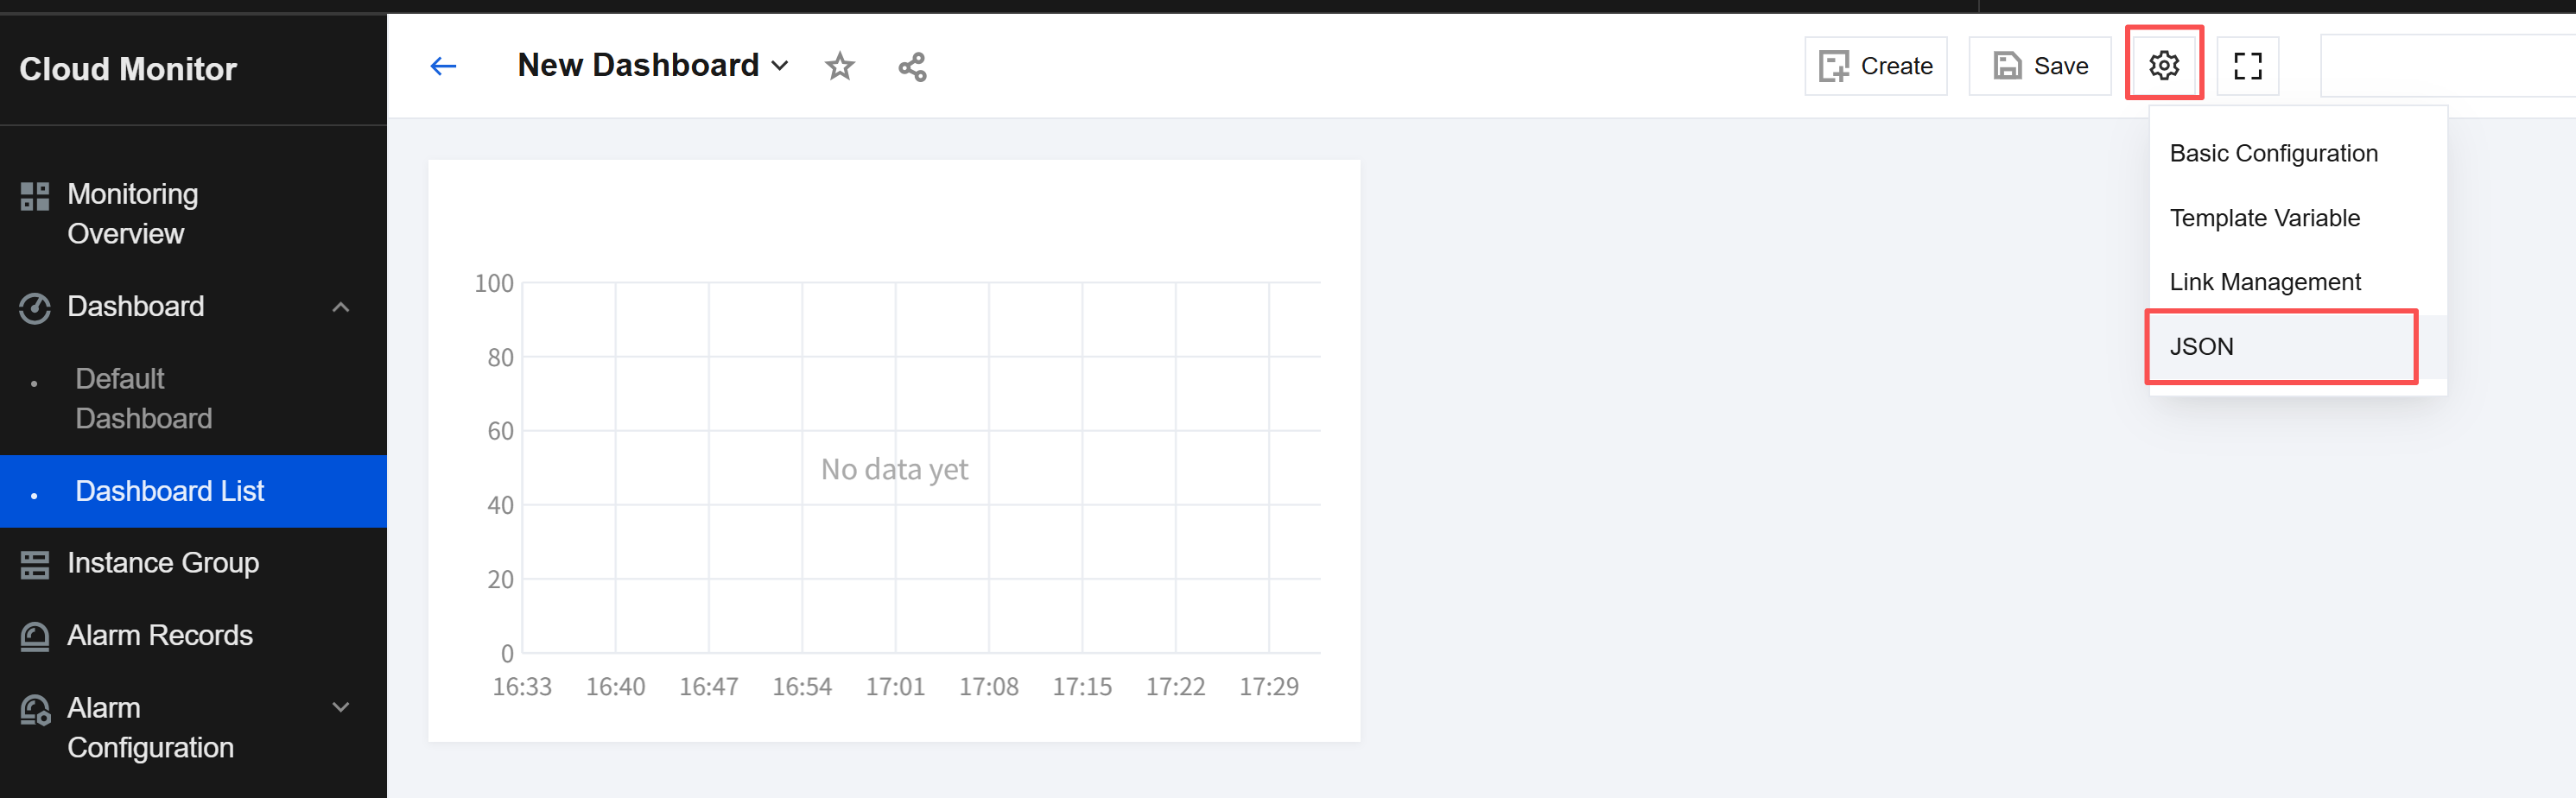
- You can copy the JSON content to deploy the dashboard to your self-built system.
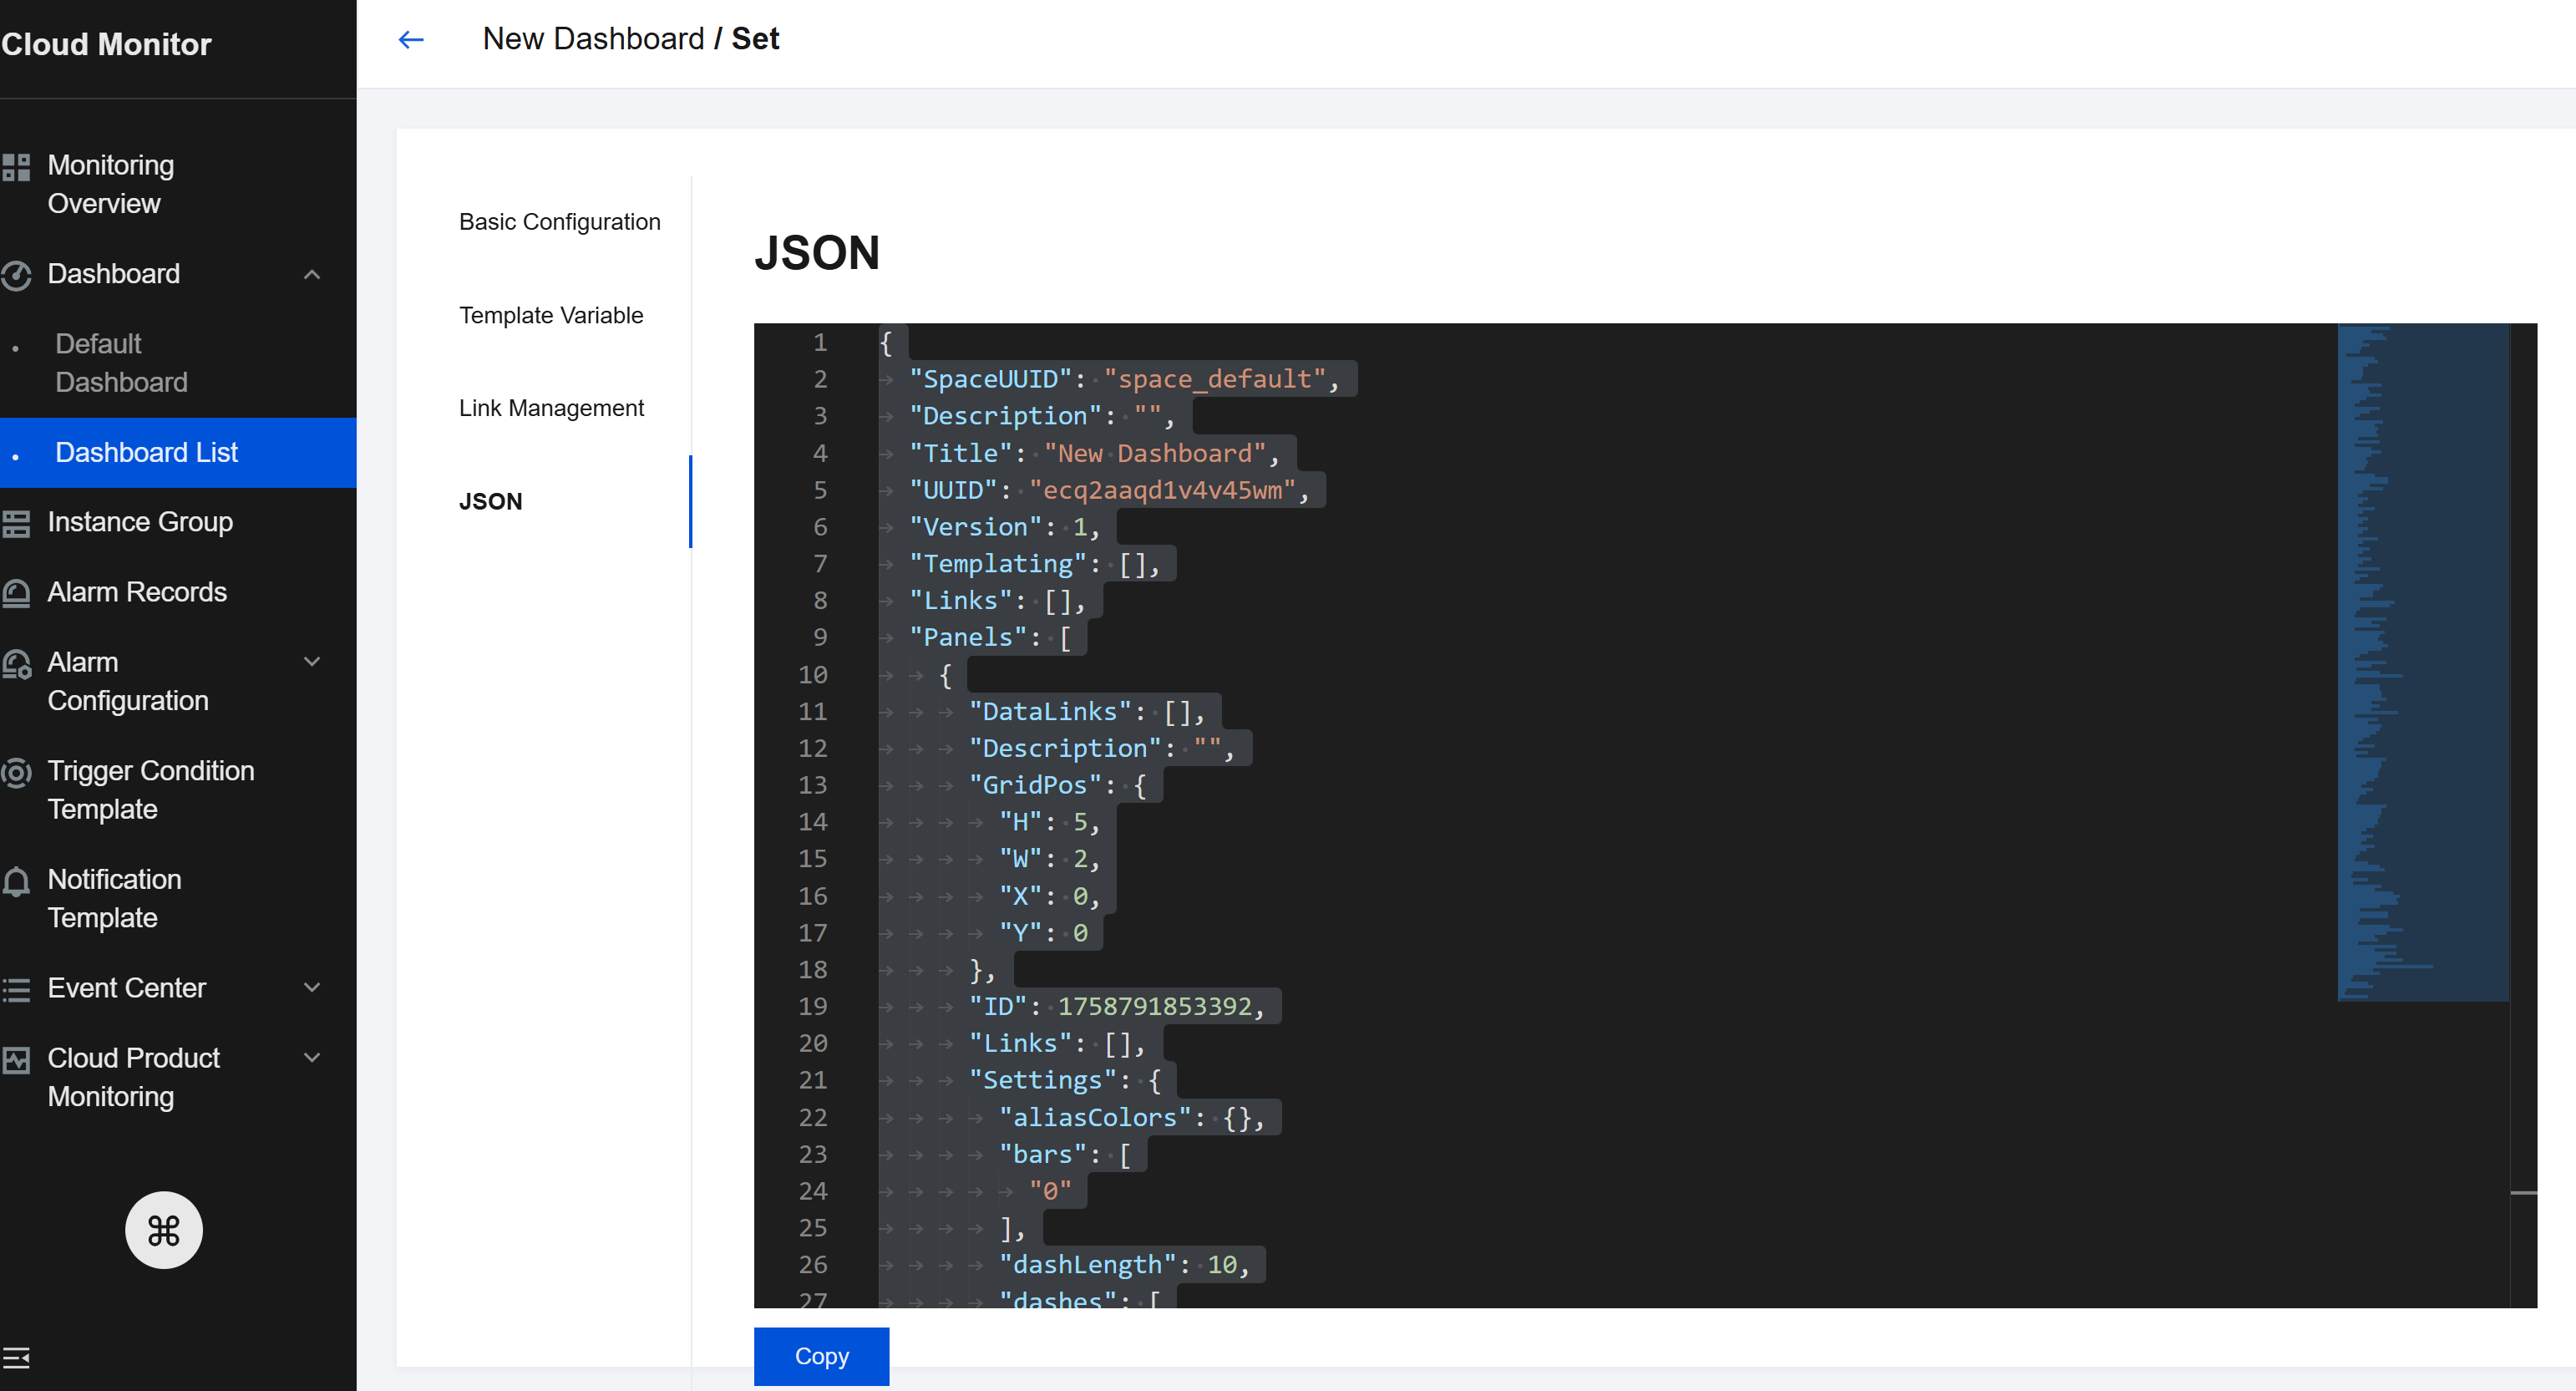
The JSON template includes the dashboard's attributes, template variables, and panel query fields. For the specific field description, see the following text.
- JSON field description.
{
      "Description": "",
      "Refresh": "close",
      "Title": "JSONTEST",
      "UUID": "jdq4joy56is4w60q",
      "Version": 1,
      "Templating": [],
      "Links": [],
      "Panels": [],
      "Time": {
                "From": "now-12h",
                "To": "now"
        },
}
| Name |
Description |
| Description |
Current dashboard remarks. |
| Refresh |
Auto-refresh time interval. |
| Title |
Current dashboard name. |
| UUID |
Unique ID of the dashboard. |
| Version |
Dashboard version, which increases with each save. |
| Templating |
Dashboard template variables. For more information, see Templating. |
| Link |
Dashboard link. For more information, see Links. |
| Panels |
Chart configuration. See Panels. |
| Time |
Time range of the dashboard. |
- Templating
"Templating": [ // Template variables.
        {
            "Label": "CVM instance name", // Template variable alias.
            "Multi": true, // Whether multiple selection is allowed.
            "Name": "cvm", // Tag.
            "Selected": [], // Template variable value.
            "Type": "monitor", // Template variable type.
            "TemplatingType": "basics", // Tag type: basic monitoring or custom monitoring.
      "TemplatingType": '123', // Variable ID.
        }
    ]
- Link
"Links": [ // Dashboard link.
        {
            "IncludeVars": true, // Whether to include template variables in the link parameters.
            "KeepTime": true, // Whether to include time variables in the link parameters.
            "TargetBlank": true, // Whether to open the link in a new tab.
            "Title": "xxx", // Link name.
            "Type": "other", // Link type: custom links or links to other dashboards.
            "Url": "/monitor/dashboard2/dashboards/d/130618223492100096hh64oj49rru3ctk/dashboard2-convergecloud_user_dir",  // Link address.
            "ID": 0 // ID
        }
    ]
- Panels
"Panels": [ // Panel configuration.
        {
            "Collapsed": false,  // Whether the chart group is collapsed.
            "Datasource": null, // Data source.
            "GridPos": { // Chart position.
                "H": 1,
                "W": 6,
                "X": 0,
                "Y": 0
            },
            "ID": 1595472129140, // Chart ID.
            "Panels": [], // Panel is a field for chart groups, containing sub-panels.
            "Title": "Default Chart Group", // Title.
            "Type": "row" // Chart type.
        },
        {
            "DataLinks": [], // Data links configured for the chart.
            "Description": "", // Remarks for the chart.
            "GridPos": {
                "H": 5,
                "W": 6,
                "X": 0,
                "Y": 1
            },
            "ID": 1595471392817,
            "Links": [], // Chart links.
            "Settings": { // Visualization configuration for the chart.
                "aliasColors": {},
                "bars": false,
                "dashLength": 10,
                "dashes": false,
                "datasource": null,
                "decimals": 2, // Legend precision.
                "fieldConfig": {
                    "defaults": {
                        "custom": {}
                    },
                    "overrides": []
                },
                "fill": "0.8", // Chart fill transparency.
                "fillGradient": 0,
                "gridPos": {
                    "h": 8,
                    "w": 12,
                    "x": 0,
                    "y": 0
                },
                "hiddenSeries": false,
                "id": "1595471392817", // ID of the chart panel.
                "legend": {// Legend settings.
                    "alignAsTable": [ // Whether the legend is displayed in table form.
                        "1"
                    ],
                    "avg": [// Whether to display the average value. ['1'] for true; ['0'] for false.
                        "1"
                    ],
                    "current": [// Whether to display the current value. ['1'] for true; ['0'] for false.
                        "1"
                    ],
                    "max": [// Whether to display the maximum value. ['1'] for true; ['0'] for false.
                        "1"
                    ],
                    "min": [// Whether to display the minimum value. ['1'] for true; ['0'] for false.
                        "1"
                    ],
                    "rightSide": [// Whether to place the legend on the right. ['1'] for true; ['0'] for false.
                        "1"
                    ],
                    "show": [// Whether to display the legend. ['1'] for true; ['0'] for false.
                        "1"
                    ],
                    "total": [// Whether to display the cumulative value. ['1'] for true; ['0'] for false.
                        "1"
                    ],
                    "values": false
                },
                "lines": [// Whether to display the curve. ['1'] for true; ['0'] for false.
                    "1"
                ],
                "linesType": true, // Whether to display a smooth curve. ['1'] for true; ['0'] for false.
                "linewidth": "2", // Curve width.
                "markline": { // Mark settings.
                    "marklineMax": {
                        "max": [// Whether to display the maximum value. ['1'] for true; ['0'] for false.
                            "1"
                        ]
                    }
                },
                "nullPointMode": "1", // Display method for null values in the data. 0: connects null data; 1: does not fill in the gaps caused by null values; 2: automatically replaces null values with zeros.
                "options": {
                    "dataLinks": [] // Array of data links.
                },
                "percentage": false,
                "pointradius": 2,
                "points": false,
                "renderer": "flot",
                "seriesOverrides": [],
                "spaceLength": 10,
                "stack": [// Whether to display data in a stacked format. ['1'] for true; ['0'] for false.
                    "1"
                ],
                "steppedLine": false,
                "targets": [
                    {
                        "refId": "A",
                        "scenarioId": "random_walk"
                    }
                ],
                "thresholds": [],
                "timeFrom": null,
                "timeRegions": [],
                "timeShift": null,
                "title": "New Chart",
                "tooltip": {
                    "shared": true,
                    "sort": 0,
                    "value_type": "individual"
                },
                "type": "graph",
                "xaxis": {
                    "buckets": null,
                    "mode": "time",
                    "name": null,
                    "show": true,
                    "values": []
                },
                "yaxes": [
                    {
                        "decimals": 2, // Left y-axis precision.
                        "format": "%", // Left y-axis label unit.
                        "label": null,
                        "logBase": 1,
                        "max": 2, // Maximum value of the left y-axis coordinates.
                        "min": 0, // Minimum value of the left y-axis coordinates.
                        "show": [// Whether to display the left y-axis. ['1'] for true; ['0'] for false.
                            "1"
                        ]
                    },
                    {
                        "decimals": 2,
                        "format": "",
                        "label": null,
                        "logBase": 1,
                        "max": null,
                        "min": null,
                        "show": [
                            "1"
                        ]
                    }
                ],
                "yaxis": {
                    "align": false,
                    "alignLevel": null
                }
            },
            "Targets": [ // Metric configuration.
                {
                    "Aggregate": "", // Statistical method.
                    "CompareLastWeek": false, // Week-on-week comparison.
                    "CompareYesterday": false, // Day-on-day comparison.
                    "Conditions": [ // Filter conditions.
                        {
                            "Dimension": [
                                "{\"InstanceId\":\"ins-19827u5b\"}",
                                "{\"InstanceId\":\"ins-xxooxxoo\"}",
                                "{\"InstanceId\":\"ins-19719mfp\"}"
                            ],
                            "Region": "region-name",
                            "Type": "normal"
                        }
                    ],
                    "ConfigId": "cvm",
                    "Datasource": "DS_QCEMetric", // Product type.
                    "DimensionKey": [
                        "InstanceId"
                    ],
                    "GroupBy": [ // groupby
                        "InstanceId"
                    ],
                    "MetricNames": [ // Metric names.
                        "BaseCpuUsage"
                    ],
                    "Namespace": "QCE/CVM", // Namespace.
                    "Period": 60 // Granularity.
                },
            ],
            "Title": "Single Metric - Default Configuration", // Chart name.
            "Type": "graph" // Chart type.
        },
    ]


