

The monitoring overview module provides an entry for viewing the overall monitoring status of cloud products. You can view the service health status from the past 24 hours, monitoring timeline from the past 7 days, exception monitoring status, and other information in this module.
Operation steps:
- Log in to the cloud platform console and click Cloud Monitor to go to the Monitoring Overview page by default.
- The Monitoring Overview page contains the following four modules.
- Service Health Status in the Last 24 Hours
It displays the current three statuses of cloud resources, including Normal, Reminder, and In Alarm. The number of objects affected by abnormal cloud resources is also displayed.
- Normal: no resource exceptions.
- Reminder: Exceptions occurred in resources in the last 24 hours.
- In Alarm: There are currently resources in an abnormal status that have not been restored.
You can hover over the abnormal status icon to view the alarm exception records, and select the region where the cloud resource is located in the drop-down list.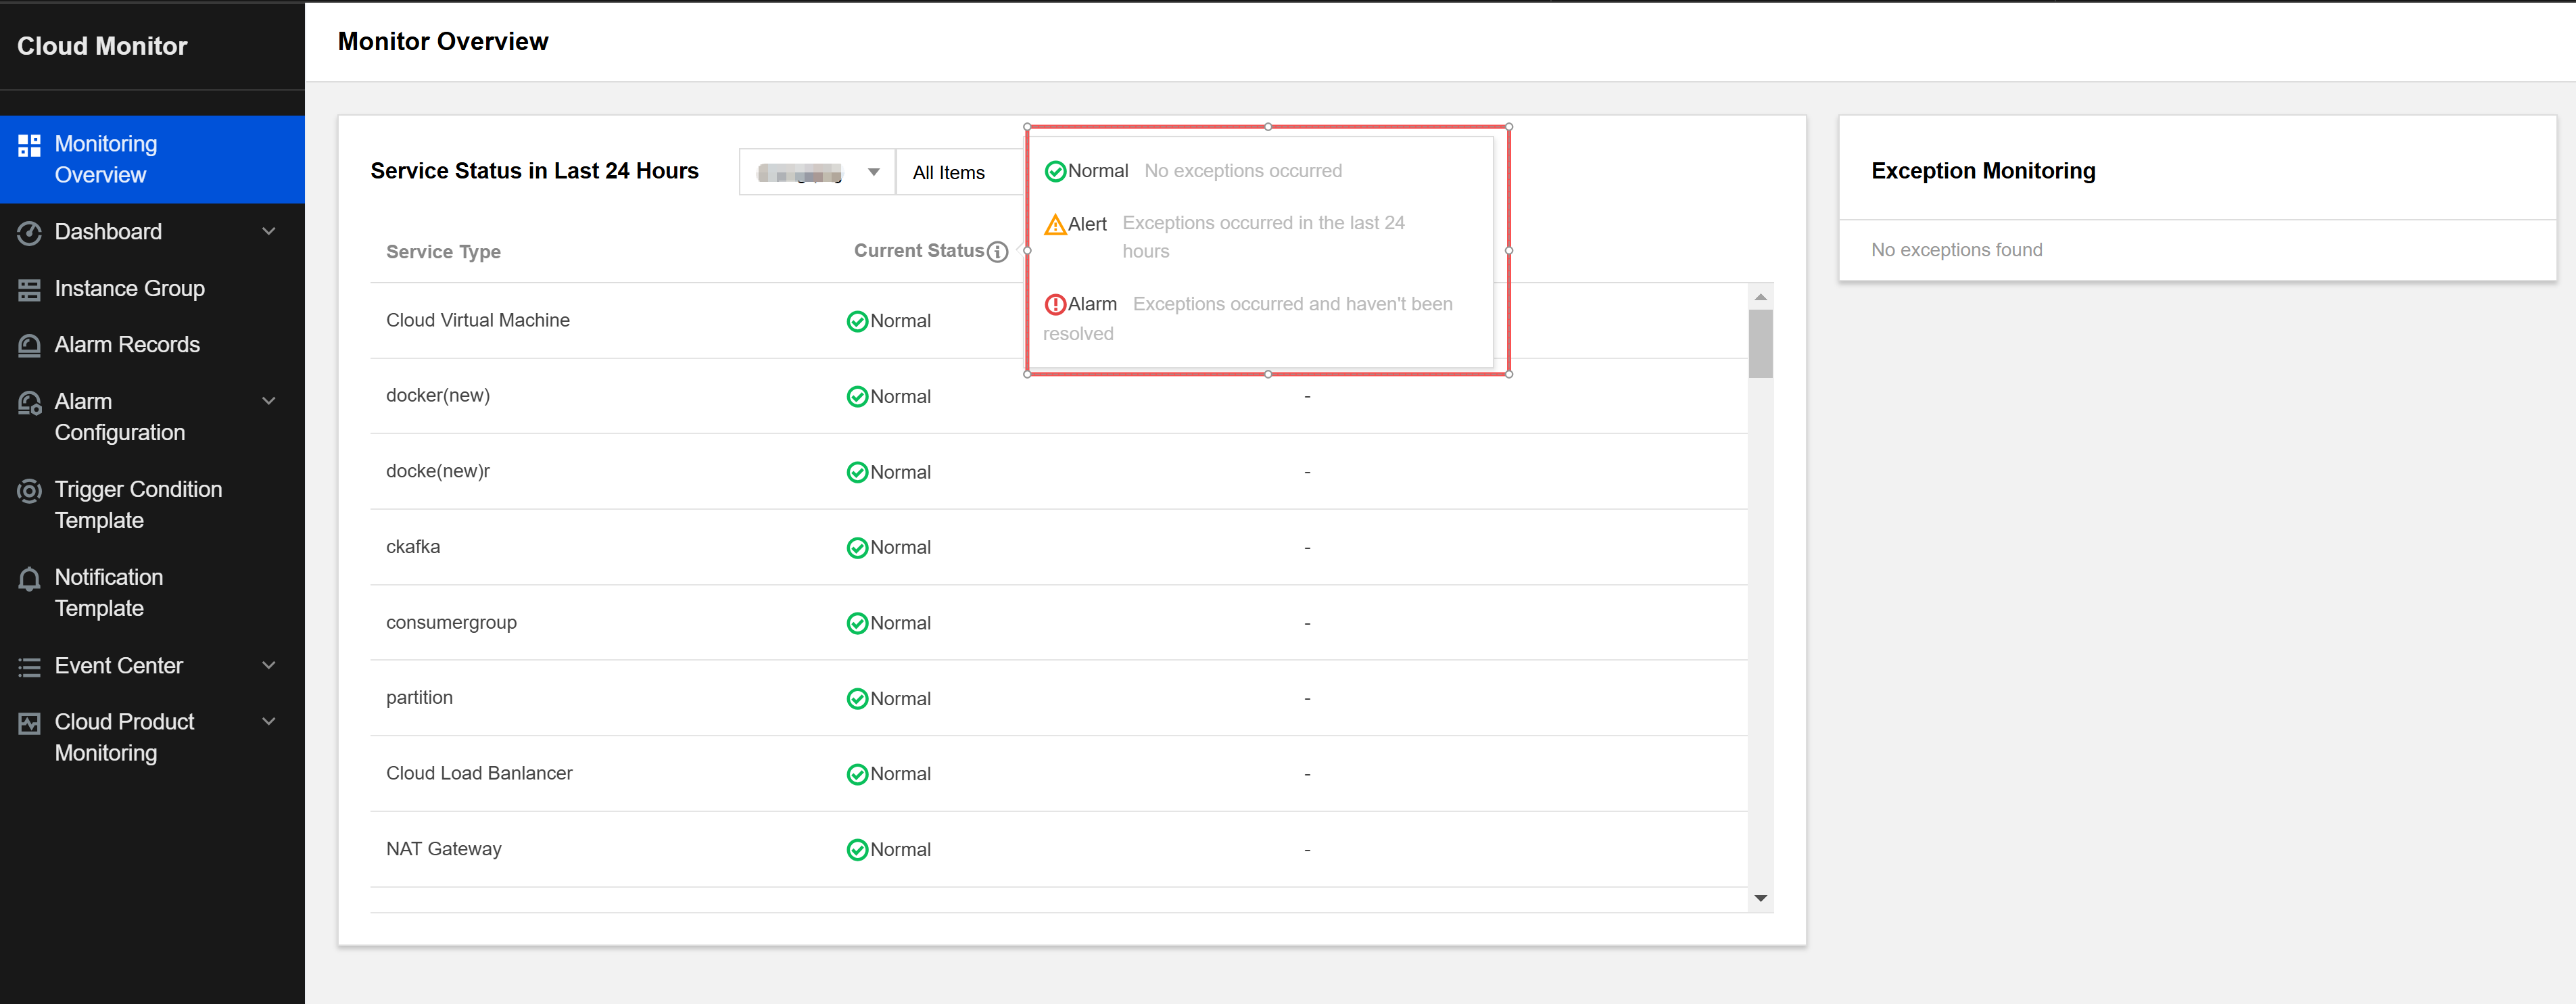
- Exception Monitoring
It displays the number of policies for which no alarm receiving group is configured under the current account. You can click Configure Reception Group to go to the alarm policy list for configuration.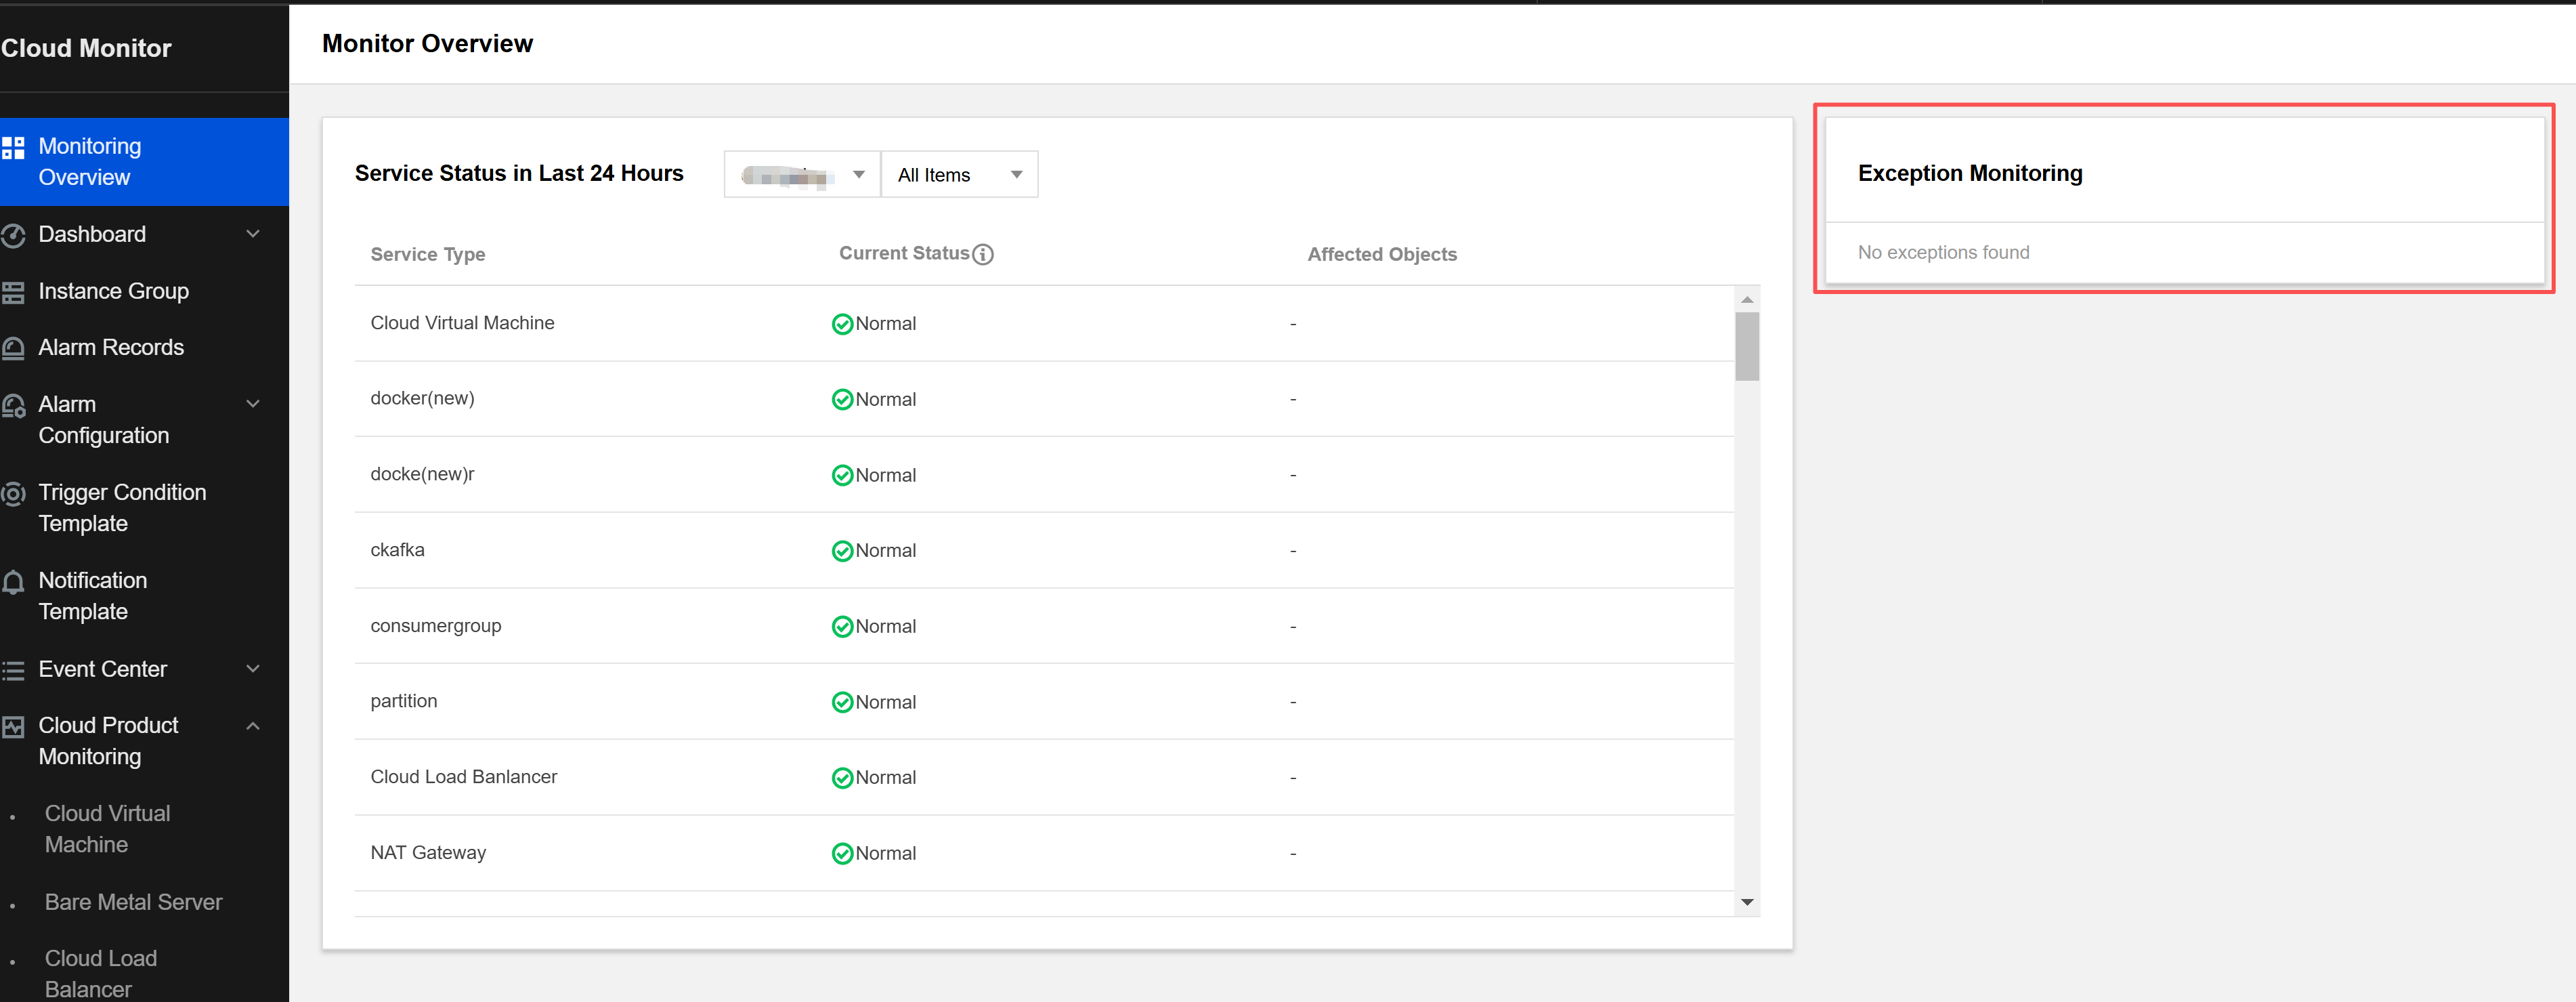
- Service Health Status in the Last 24 Hours
