

The CLB access log collects detailed information about each client request, including request time, request path, client IP and port, return code, response time, and other information. Access logs can help you understand client requests, assist in troubleshooting, analyze and sort out user behavior, etc. Currently, access logs can be stored in CLS, with minute-level log reporting and online multi-rule retrieval supported.
The access log of CLB is mainly used for troubleshooting to help businesses quickly locate problems. Access log features include log reporting, log storage and query.
Note:
- Only the IPv4 version of the CLB service supports the configuration of access logs.
- Only layer-7 CLB supports the configuration of access logs, while layer-4 CLB does not support it.
- Both public and private network types of CLB support the configuration of access logs.
Step 1: Enable access log storage in CLS
Log in to the CLB console and click LB Instance List in the left sidebar.
On the LB Instance List page, click the target CLB ID.
In the Access Log (layer-7) module on the Basic Information page, click the pencil icon to enable the Cloud Log Service (CLS).
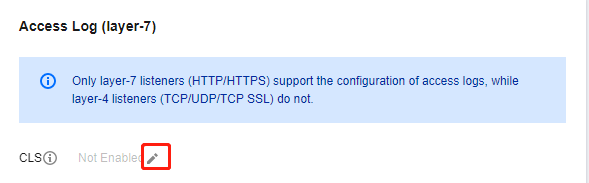
In the Authorization dialog box that pops up, click Go to Cloud Access Management, and then click Agree to Authorization.
After authorization is successful, return to the instance details page, click the pencil icon, and in the pop-up Modify CLS log storage location dialog box, turn on Enable log, select the logset and log topic for storing access logs, and click Submit. If you have not created a logset or log topic, create the relevant resources and then select a specific storage location.
Note:
It is recommended to select the log topic with the CLB logo under the clb_logset log set. The difference between a log topic with the CLB logo and a normal log topic is:
- Log topics with the CLB logo are automatically indexed by default; ordinary log topics need to be indexed manually, otherwise search is not supported.
- Log topics with the CLB logo support dashboards by default; ordinary log topics require manual configuration of dashboards.
After the configuration is completed, click the logset or log topic to jump to the search and analysis page of the CLS console.
(Optional) If you want to close the access log, click the pencil icon again, close it in the pop-up "Modify CLS log storage location" dialog box, and submit it.
Step 2: Configure the log topic index
Note:
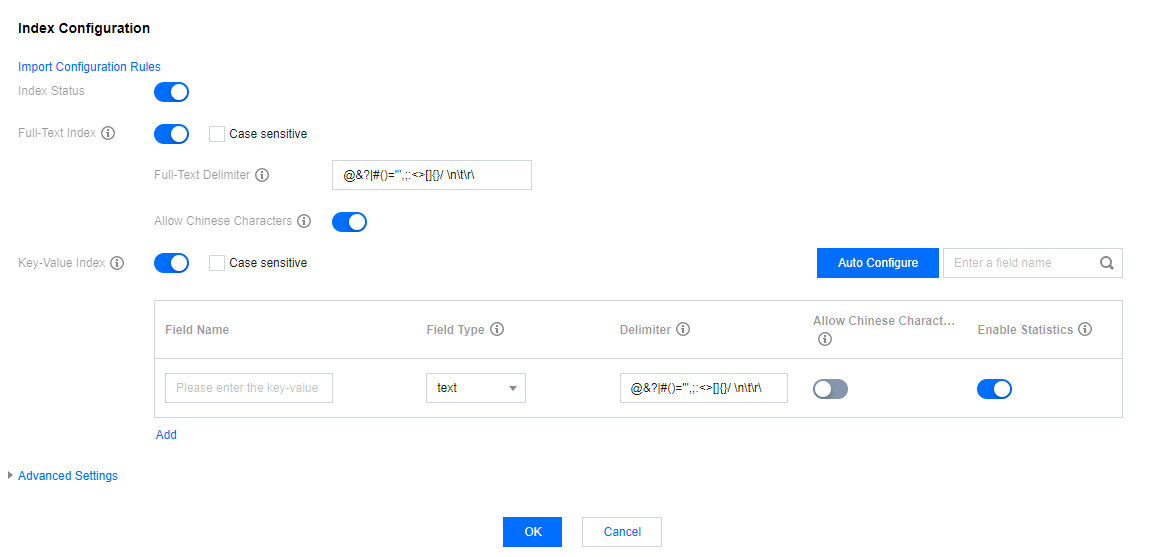
The log topic of the access log configured for a single instance must be indexed; otherwise, the log cannot be searched.
The recommended indexes are as follows:
| Key-value index | Field Type | Word segmentation |
|---|---|---|
| server_addr | text | No need to configure word segmentation |
| server_name | text | No need to configure word segmentation |
| http_host | text | No need to configure word segmentation |
| status | long | - |
| vip_vpcid | long | - |
- Log in to the CLS console and click Log Topic in the left sidebar.
- On the Log Topic page, click the target log topic ID.
- On the log topic details page, click the Index Configuration tab and click Edit in the upper-right corner to add an index. After completing the configuration, click OK.
Step 3: View access logs
- Log in to the CLS console and click Search and Analysis in the left sidebar.
- On the Search and Analysis page, select the logset, log topic, and time range, and click Search and Analysis to search for access logs reported by CLB to CLS.