

Overview
Monitoring reports provide users with service data statistics for object storage. Users can understand the trends of various data through monitoring report data. Monitoring reports include basic data statistics and return code statistics. The basic data statistics page provides users with specific service statistics and graphically displays the service usage in the form of trend charts.
Directions
- Log in to the COS console.
- Click Monitoring Report > Basic Data Statistics on the left menu to enter the basic data statistics page.
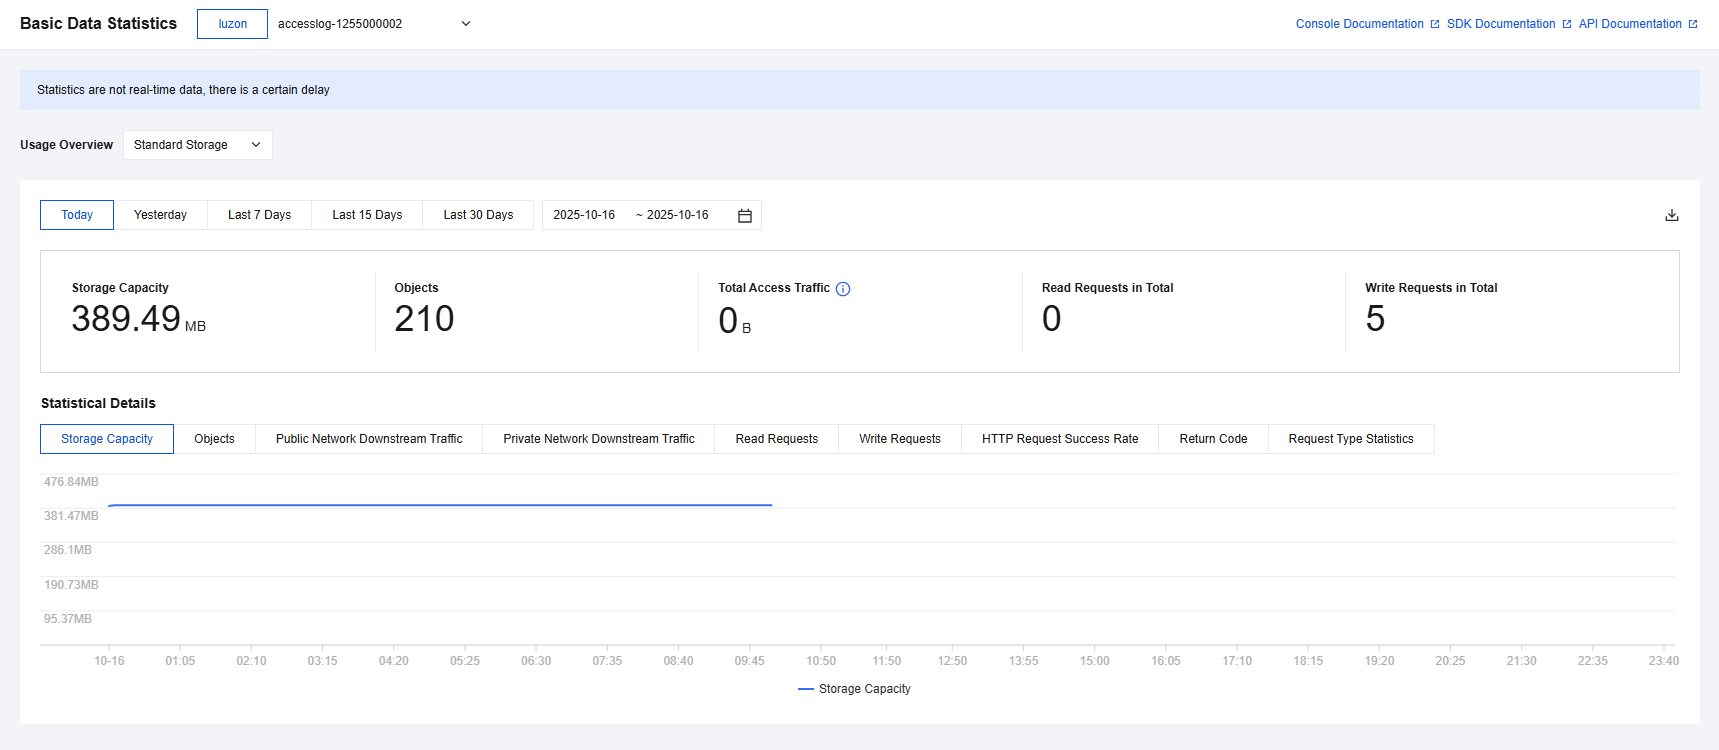
- The basic data statistics page allows you to switch regions, buckets, and storage types to view data for today, yesterday, the past 7 days, the past 15 days, and the past 30 days:
- The corresponding period is displayed with specific statistics: storage capacity, number of objects, total access traffic, total number of read requests, and total number of write requests.
- The corresponding period is displayed in a trend chart: storage statistics, quantities of objects, public network downstream traffic, private network traffic, read request statistics, and write request statistics.
- The page supports exporting data to local storage. Click the export button on the right side of the date column to export data. There may be a delay in data, so refresh the page to reload it.
- The basic data statistics page allows you to switch regions, buckets, and storage types to view data for today, yesterday, the past 7 days, the past 15 days, and the past 30 days:
