

Directions
- Log in to the COS console.
- Click Monitoring Report > Return Code Statistics on the left menu to go to the return code statistics page.
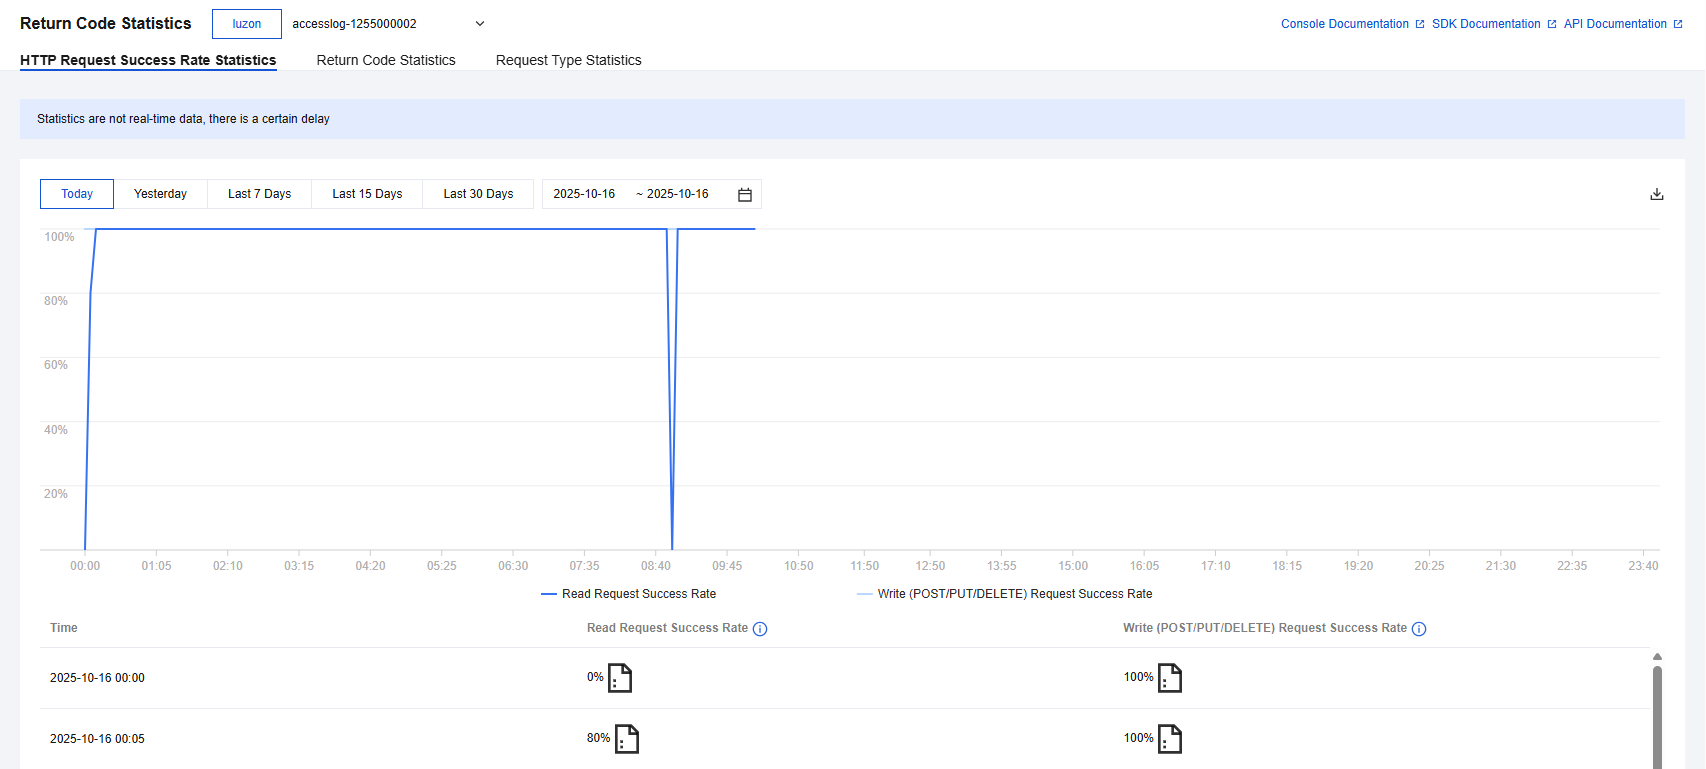
- The return code statistics page is in the form of trend charts and lists for the corresponding periods. You can switch projects and buckets to view data for the current day, yesterday, the past 7 days, the past 15 days, and the past 30 days:
- HTTP request success rate statistics
The HTTP request success rate is calculated by the ratio of the number of occurrences of each return code to the total number of requests. This data statistic shows the success rate of HTTP requests (including read and write requests) initiated to COS by users. - Return code statistics
Return code statistics are statistics of the number of HTTP request return codes that appear within the time range selected by the user, which can help users locate access situations. - Request type statistics
Request type statistics categorize the number of requests by request type, mainly including 5 requests: GET, HEAD, PUT, POST, and DELETE.
- HTTP request success rate statistics
- The upper part of the page displays the trend graph, and the lower part displays the statistics list. For each column with data in the statistics list, you can view the details of the success rate.
- The page supports exporting data to local storage. Click the export button on the right side of the date column to export data. There may be a delay in data, so refresh the page to reload it.
- The return code statistics page is in the form of trend charts and lists for the corresponding periods. You can switch projects and buckets to view data for the current day, yesterday, the past 7 days, the past 15 days, and the past 30 days:
